Weekly Inflation Falls 0.35% in Pakistan, But Prices Are Still 11.32% Higher Than a Year Ago

Pakistan's short-term inflation eased in the last week of October, but the relief is only part of the story. The Sensitive Price Indicator (SPI) fell 0.35 percent week-on-week in the week ended 29 October 2026, according to data released by the Pakistan Bureau of Statistics (PBS) on Friday, 30 October. At the same time, the SPI stood 11.32 percent higher than in the same week a year earlier. Both numbers are true at once, and confusing them is the easiest way to misunderstand this release: the weekly figure says prices of the basket edged down over seven days, while the yearly figure says the same basket still costs a great deal more than it did twelve months ago.
That distinction also resolves the two headlines that reached readers on Friday morning. Dawn headlined the release as short-term inflation rising to 11.32 percent in the last week of October, driven by perishable food prices — the yearly rate. ARY News headlined it as weekly inflation dropping 0.35 percent — the weekly change. They are not two different stories, and neither is wrong; they are two views of the same PBS release, one looking across the week and the other across the year. This article reports both, with the item-by-item detail behind each, so that readers can see exactly what got cheaper, what got dearer, and what did not move at all.
The headline numbers, then, are these. The combined SPI declined 0.35 percent from the previous week. Compared with the same week last year, the combined SPI increased 11.32 percent. The previous week's release, for the week ended 22 October, had shown a weekly increase of 0.65 percent and a yearly increase of 11.85 percent. On both measures, therefore, this week was an improvement on last week: the weekly change swung from a rise of 0.65 percent to a fall of 0.35 percent, and the yearly rate eased from 11.85 percent to 11.32 percent. The easing is real, but it should not be overstated. A yearly rate above 11 percent still means that the weekly shopping basket costs roughly a ninth more than it did a year ago, and the weekly fall, while welcome, reverses only a small part of the increases that built up over the year.
What is the SPI, and why does it move every week when the better-known inflation rate is monthly? The SPI is the PBS's weekly gauge of short-term price movements. It tracks 51 essential commodities, collected from 50 markets across 17 cities in Pakistan, and it is published every week so that policymakers, traders and households can see price pressure building — or easing — in near real time, rather than waiting for the monthly Consumer Price Index. The basket is deliberately narrow and essential: food staples, cooking fuel, household energy and a handful of everyday items. That narrowness is both its strength and its limit. It reacts quickly to a tomato shortage or a chicken price swing, which is why it can jump or fall sharply in a single week, but it is not a complete picture of all consumer prices. A weekly fall in the SPI is good news for the kitchen budget; it is not, by itself, proof that overall inflation has turned.
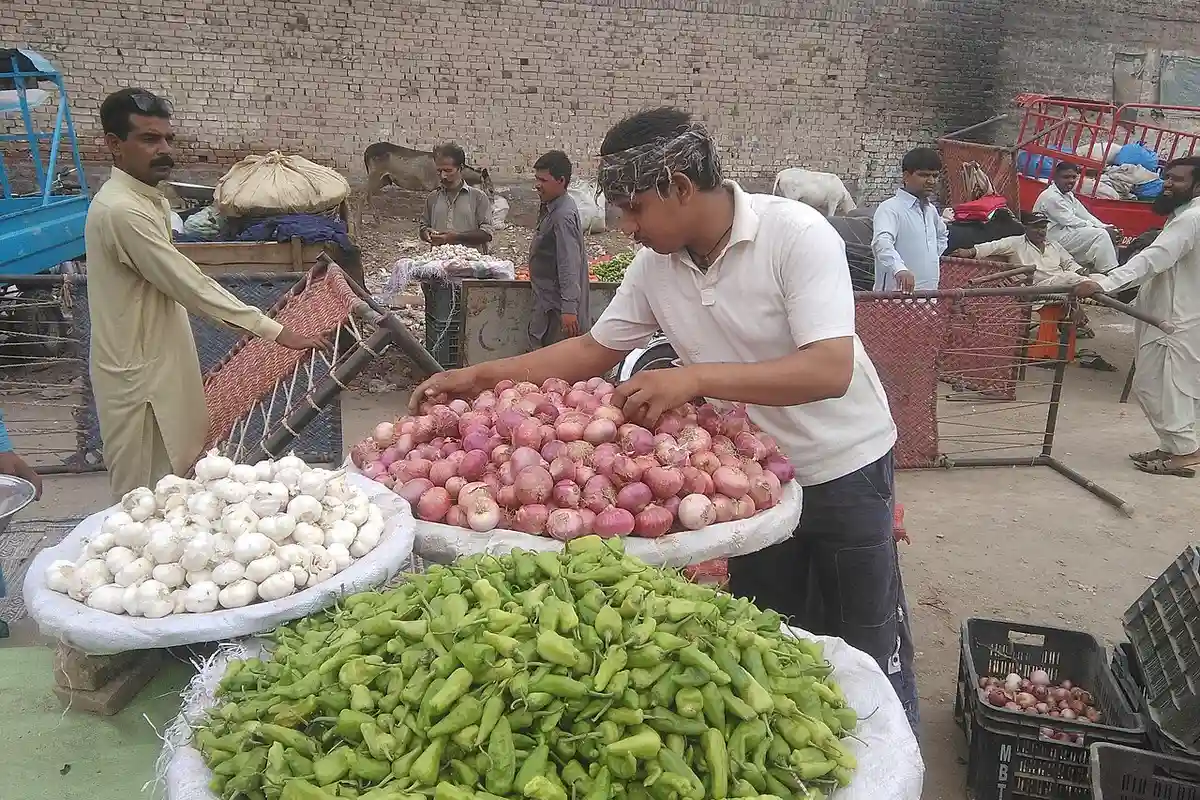
The weekly detail shows a market that mostly stood still, with sharp moves at the edges. Of the 51 items in the basket, prices of 15 items (29.41 percent) increased during the week, prices of 12 items (23.53 percent) decreased, and prices of 24 items (47.06 percent) remained unchanged. Nearly half the basket did not move at all, which is why the overall weekly change was small despite some very large individual moves. The story of the week is therefore not a broad-based fall in prices, but a set of offsetting moves: a few items fell enough to outweigh a few items that rose sharply, while most items sat exactly where they had been.
The largest weekly fall was in electricity charges for the first consumption quintile, down 3.92 percent. That matters because electricity is not a discretionary purchase: for the lowest-spending households, the first block of electricity is a fixed cost of running a home, and a fall there is felt immediately in the monthly bill. Chicken prices fell 2.95 percent, and eggs became 2.81 percent cheaper — two of the most important sources of affordable protein in Pakistani households, and two items whose prices are watched closely because they move so often. Wheat flour, the staple behind roti, fell 0.83 percent. Liquefied petroleum gas (LPG) fell 0.73 percent, bananas 0.71 percent, rice IRRI-6/9 and pulse masoor 0.43 percent each, petrol 0.39 percent, sugar 0.35 percent and powdered milk 0.33 percent. Taken together, those falls cover the core of the weekly kitchen: flour, chicken, eggs, cooking gas, petrol and sugar all cheaper than the week before.
Against those falls, one item dominated the weekly rises: tomatoes surged 34.91 percent in a single week, by far the largest increase among the 51 items. Tomatoes are a perishable, seasonal item whose price can spike when supply to city markets tightens, and a jump of that size in seven days is the kind of move that households notice at the vegetable stall even when the overall index is falling. Potatoes rose 3.27 percent, diesel 2.53 percent, pulse gram 2.11 percent, plain bread 1.29 percent, onions 0.62 percent, fresh milk 0.48 percent, curd 0.46 percent, vegetable ghee (2.5 kg) 0.29 percent and firewood 0.20 percent. Diesel's rise deserves a note of its own: diesel powers freight, farming and public transport, so a weekly rise there tends to feed through to other prices with a lag, even when the immediate index effect is small. The same logic applies, in the other direction, to petrol's weekly fall of 0.39 percent, which sits alongside Pakistan's daily fuel price revision system and the petrol price of Rs377.91 per litre carried in the 30 October revision coverage.
The yearly picture is starker than the weekly one, and it is where the 11.32 percent figure comes from. On a year-on-year basis, LPG recorded the highest increase of all, up 106.86 percent — more than double the price of a year ago. Electricity charges for the first quintile rose 52.38 percent over the year, diesel 45.13 percent and petrol 43.61 percent. Those four energy items alone explain much of the pressure on household budgets, because they raise the cost of cooking, lighting, travel and transport at the same time. Among foods, wheat flour rose 34.87 percent over the year, chicken 31.72 percent, chilli powder 15.55 percent, mutton 14.66 percent, plain bread 12.26 percent, beef 12.10 percent, onions 8.99 percent and prepared tea 8.41 percent. A household buying the same flour, chicken and bread as last year is therefore paying roughly a third more for flour and chicken, even though both items became slightly cheaper in this particular week.
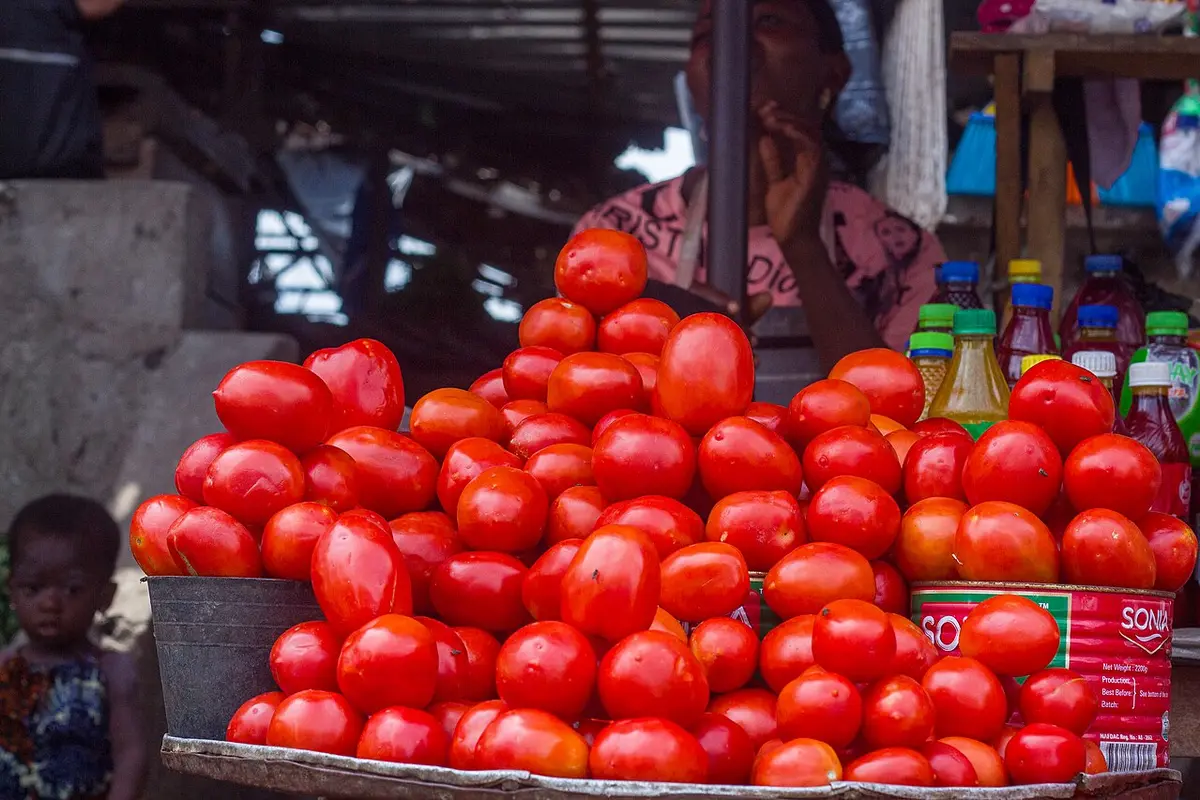
The yearly falls are just as instructive, because they show that not everything has moved in the same direction. Potatoes fell 38.67 percent compared with a year ago, tomatoes 27.99 percent, eggs 26.70 percent, sugar 25.21 percent, salt powder 14.86 percent, gur (jaggery) 8.51 percent, pulse masoor 8.37 percent and pulse moong 6.42 percent. Tomatoes are the clearest example of why the weekly and yearly figures must be read together: up 34.91 percent in a week, yet still 27.99 percent cheaper than a year ago, because last year's tomato price had been far higher. The same pattern, in milder form, applies to sugar: down 0.35 percent this week and down 25.21 percent over the year, a yearly fall that sits alongside the sugar committee's recent discussions of surplus stocks and export guidelines, and alongside a retail sugar price that the 24 October essential-commodities committee had put well below its Rs155 per kilogram target. Potatoes, down sharply over the year despite a 3.27 percent weekly rise, tell the same story from the other side: a single week's move can run against the year's trend.
Breaking the yearly rate down by spending group shows that the burden has not fallen evenly. The PBS divides households into five expenditure quintiles, from the lowest-spending to the highest-spending. The yearly SPI increase was 8.07 percent for the lowest expenditure group, 9.92 percent for the second quintile, 8.95 percent for the third, 9.51 percent for the fourth, and 12.13 percent for the highest expenditure group, giving the combined 11.32 percent. The highest-spending households therefore faced the largest yearly increase, while the lowest-spending group faced the smallest — a pattern that reflects the different baskets each group buys, with energy and transport weighing more heavily at the top. That does not mean the lowest-income households are comfortable: an 8.07 percent yearly rise on a tight budget, concentrated in flour, chicken and cooking fuel, still forces hard choices, and the weekly fall in electricity charges for the first quintile is precisely targeted at that pressure point. But it does mean that a single headline rate hides real differences between households, and that the combined 11.32 percent should not be read as every family's experience.
For households, the practical question is what this release changes at the shop. In the short term, the honest answer is: something, but not everything. Chicken, eggs, flour, LPG, petrol and sugar are all slightly cheaper than last week, which is real money on a weekly shop. Tomatoes, potatoes, diesel, onions and fresh milk are dearer, and tomatoes sharply so, which will eat into part of that saving for families that buy vegetables daily. The larger truth is that the weekly basket remains more than 11 percent dearer than a year ago, driven above all by LPG and electricity, and no single week's fall can undo that. Families should therefore treat this release as a small improvement in the direction of travel, not as a return to last year's prices. The next two weekly releases will matter more than this one: if the weekly change stays negative, the yearly rate will keep easing as last autumn's high readings drop out of the comparison; if tomatoes and diesel keep rising, the weekly index could turn positive again just as quickly as it turned negative this week.
For policymakers, the release poses a different question. The SPI exists so that price pressure can be spotted early, and this week's data points in two directions at once. The falls in electricity, chicken, eggs and flour suggest that some of the pressures that pushed the yearly rate to 11.85 percent last week are easing. The surge in tomatoes and the rises in diesel, potatoes and onions suggest that perishable and transport-driven pressures have not gone away. The State Bank and the finance authorities will read this release alongside the monthly CPI, not instead of it, and they will be watching whether the weekly easing survives the next few weeks. The sugar and fuel stories running alongside this release are part of the same picture: the sugar committee's consumer-first approach to export guidelines, and the daily fuel revision mechanism, are both attempts to keep essential prices stable while letting markets clear — and both will be judged, in the end, by the same weekly PBS numbers reported here.
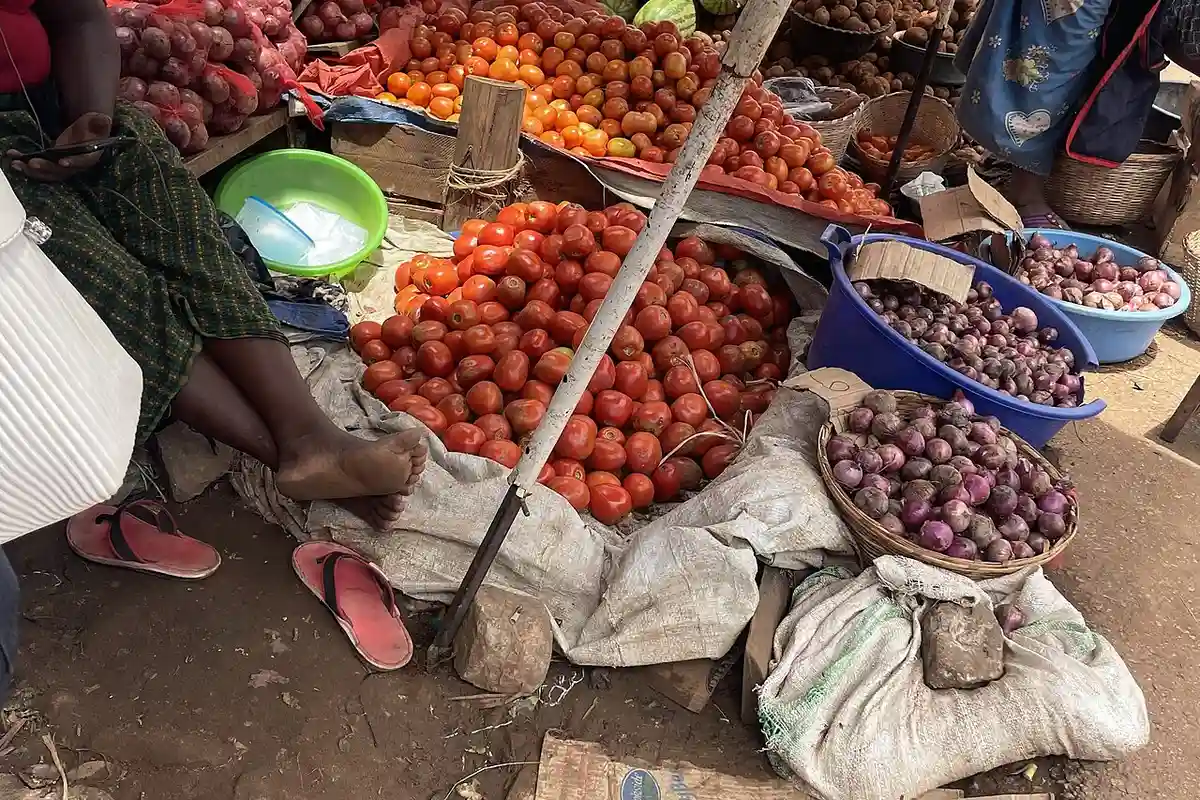
What should readers watch for next? First, next Friday's SPI release, for the week ended 5 November: whether the weekly change stays negative, and whether the yearly rate continues down from 11.32 percent towards, or below, 11 percent. Second, tomato prices specifically: a 34.91 percent weekly surge is the kind of move that either corrects quickly when fresh supply arrives, or persists and drags the next weekly reading up with it. Third, diesel and LPG: diesel rose 2.53 percent this week even as petrol fell, and LPG, despite a 0.73 percent weekly fall, remains more than double its price of a year ago — both are items where a single policy or supply decision can move the index visibly. Fourth, the quintile breakdown: whether the lowest-spending group's yearly rate stays below the combined rate, or whether food price rises push it up towards the average. TaazaPulse will report each weekly PBS release in the same form — weekly change, yearly rate, the items that moved most, and the quintile picture — so that readers can follow the trend without having to reconcile conflicting headlines themselves.
Until then, the responsible summary of this story is a short one, and this article has kept to it deliberately. In the week ended 29 October 2026, the Sensitive Price Indicator fell 0.35 percent from the previous week, with 15 of 51 items rising, 12 falling and 24 unchanged, according to the Pakistan Bureau of Statistics. Compared with the same week a year earlier, the indicator rose 11.32 percent, with LPG up 106.86 percent and electricity for the first quintile up 52.38 percent leading the increases, and potatoes, tomatoes, eggs and sugar lower than a year ago. The previous week had shown a 0.65 percent weekly rise and an 11.85 percent yearly rise, so both measures improved this week. That is genuine, if modest, relief — and it is also a reminder that weekly relief and yearly pressure can be true at the same time, and that the household budget feels both.
All figures in this article are taken from the Pakistan Bureau of Statistics Sensitive Price Indicator release for the week ended 29 October 2026, as reported on 30 October 2026 by Dawn, ARY News, Mettis Global News, PKRevenue and Benewz. Where outlets differ in emphasis, this article reports both the weekly and the yearly figure and attributes each to its measure, so that no single headline is mistaken for the whole release.
Sources
This report is based on reporting, official statements and documents from:
- Dawn — Short-term inflation rises to 11.32pc in last week of October, driven by perishable food prices (30 Oct 2026)
- ARY News — Weekly inflation drops 0.35% in Pakistan: PBS (30 Oct 2026)
- Mettis Global / MLN — Weekly SPI decrease by 0.35% (30 Oct 2026)
- PKRevenue — Pakistan SPI Inflation Rises 11.32% Annually (30 Oct 2026)
- Benewz — Pakistan's weekly inflation falls but YoY prices remain higher (30 Oct 2026)
- Wikimedia Commons — Empress Market Saddar Karachi; Pakistani bazaar stall; tomatoes at market stall; onions and tomatoes stall (image credits)
Frequently Asked Questions
Why do Dawn and ARY seem to report opposite inflation stories?
They do not — they report two different measures from the same PBS release. Dawn's 11.32% is the year-on-year change: the SPI basket costs 11.32% more than in the same week of 2025. ARY's 0.35% drop is the week-on-week change: the basket costs 0.35% less than in the previous week. Both are correct, and this article reports both, because either figure alone misleads.
What exactly is the Sensitive Price Indicator (SPI)?
The SPI is the Pakistan Bureau of Statistics' weekly gauge of short-term price movements. It tracks 51 essential commodities collected from 50 markets across 17 cities in Pakistan, and it is published every week so price pressure can be seen in near real time, rather than waiting for the monthly Consumer Price Index. Its basket is deliberately narrow — food staples, cooking fuel, household energy and everyday items — so it reacts quickly to a tomato shortage or a chicken price swing, but it is not a complete picture of all consumer prices.
Which items got cheaper this week, and which got dearer?
Cheaper week-on-week: electricity charges for the first quintile (-3.92%), chicken (-2.95%), eggs (-2.81%), wheat flour (-0.83%), LPG (-0.73%), bananas (-0.71%), rice IRRI-6/9 and pulse masoor (-0.43% each), petrol (-0.39%), sugar (-0.35%) and powdered milk (-0.33%). Dearer: tomatoes (+34.91%), potatoes (+3.27%), diesel (+2.53%), pulse gram (+2.11%), plain bread (+1.29%), onions (+0.62%), fresh milk (+0.48%), curd (+0.46%), vegetable ghee 2.5kg (+0.29%) and firewood (+0.20%). Of the 51 items, 15 rose, 12 fell and 24 were unchanged.
Why is yearly inflation still 11.32% if prices fell this week?
Because the yearly figure compares today's basket with the same week a year ago, not with last week. A 0.35% weekly fall only trims the yearly gap; it does not close it. The yearly increase is led by energy: LPG is up 106.86% year-on-year, electricity for the first quintile 52.38%, diesel 45.13% and petrol 43.61%. Wheat flour is up 34.87% and chicken 31.72% over the year, even though both fell slightly this week. Only if weekly falls continue will the yearly rate keep easing.
Did every household face the same 11.32% increase?
No. The PBS breaks the yearly rate down by spending group: 8.07% for the lowest expenditure group, 9.92% for the second quintile, 8.95% for the third, 9.51% for the fourth and 12.13% for the highest expenditure group, giving the combined 11.32%. The highest-spending households faced the largest increase, while the lowest-spending group faced the smallest — but an 8.07% rise on a tight budget, concentrated in flour, chicken and cooking fuel, still forces hard choices.
What should readers watch in the next weekly release?
Four things: whether the weekly change stays negative for the week ended 5 November; whether tomato prices correct after their 34.91% weekly surge or keep rising; diesel and LPG, where a single supply or policy decision moves the index visibly; and the quintile breakdown, to see whether the lowest-spending group's yearly rate stays below the combined rate. TaazaPulse will report each weekly PBS release in the same form — weekly change, yearly rate, biggest movers and the quintile picture.